Threat Profile
Your Threat Profile defines the adversarial objectives most relevant to your organization. Each objective is scored by likelihood and impact to reflect your business model and threat surface.
What Is Your Threat Profile
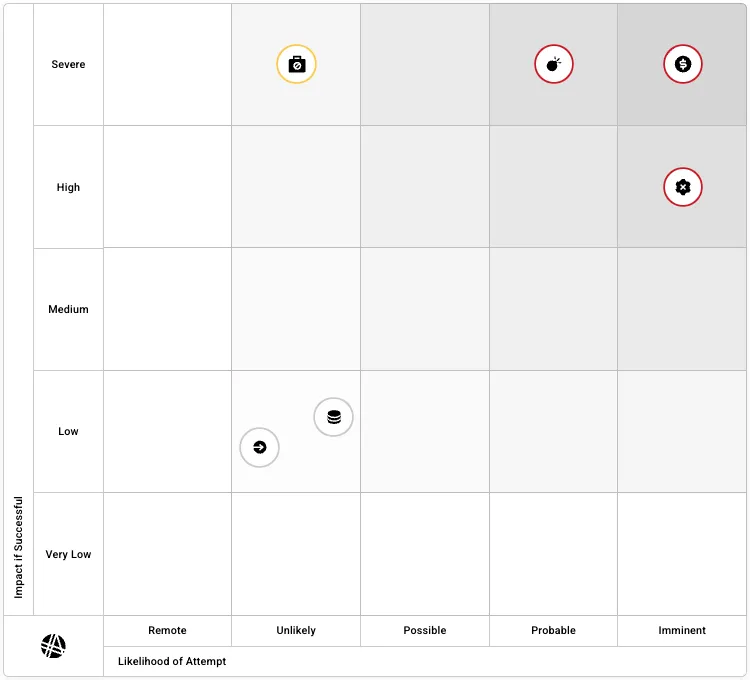
Section titled “What Is Your Threat Profile”The Threat Profile is a heat map that plots adversarial objectives against two dimensions: how likely each threat is to be attempted and how severe the impact would be if it succeeded. This gives you a visual summary of where your organization faces the greatest risk.
Interpreting the Heat Map
Section titled “Interpreting the Heat Map”The heat map evaluates inherent risk — the likelihood of a threat given current conditions in the world, your industry, and your organization, independent of your existing controls, tools, or programs.
X-axis: Likelihood of Attempt
Section titled “X-axis: Likelihood of Attempt”The x-axis represents the likelihood that a threat will be attempted against your organization, disregarding the controls and tools currently in place. This is often referred to as inherent risk: regardless of what you do, this is the risk you face.
Y-axis: Impact if Successful
Section titled “Y-axis: Impact if Successful”The y-axis represents the impact if the threat were exploited today and became an incident. Would it have material consequences for the organization?
Using the Heat Map to Guide Strategy
Section titled “Using the Heat Map to Guide Strategy”With likelihood and impact in view, you can prioritize the threat objectives that matter most. The threat landscape is consolidated into six core Threat Objectives.
This structure helps translate the heat map into clear priorities for the CyberGov and Board, aligning cyber investments to the adversarial objectives most likely to affect your organization and most capable of causing material impact.
Threat Profile in Governance Reports
Section titled “Threat Profile in Governance Reports”The Threat Profile heat map is included as a slide in both the Board Deck and CyberGov report. In reports, the heat map is scoped to the reporting period:
- If a threat objective’s score changed during the period, an arrow shows movement from the previous position to the current one.
- If no change occurred during the period, only the current position is shown (no arrow).
This lets the board see at a glance which threat objectives shifted and in what direction during the quarter.
For detailed definitions of the six threat objectives, see Threat Objectives.
To configure or update your Threat Profile, see Configuring Your Threat Profile.